
Server Monitoring That Prevents Costly Downtime
Server monitoring catches outages, slowdowns, and resource waste early, helping you safeguard customer trust, control costs, and keep services online.
ACMMAX Insights ·
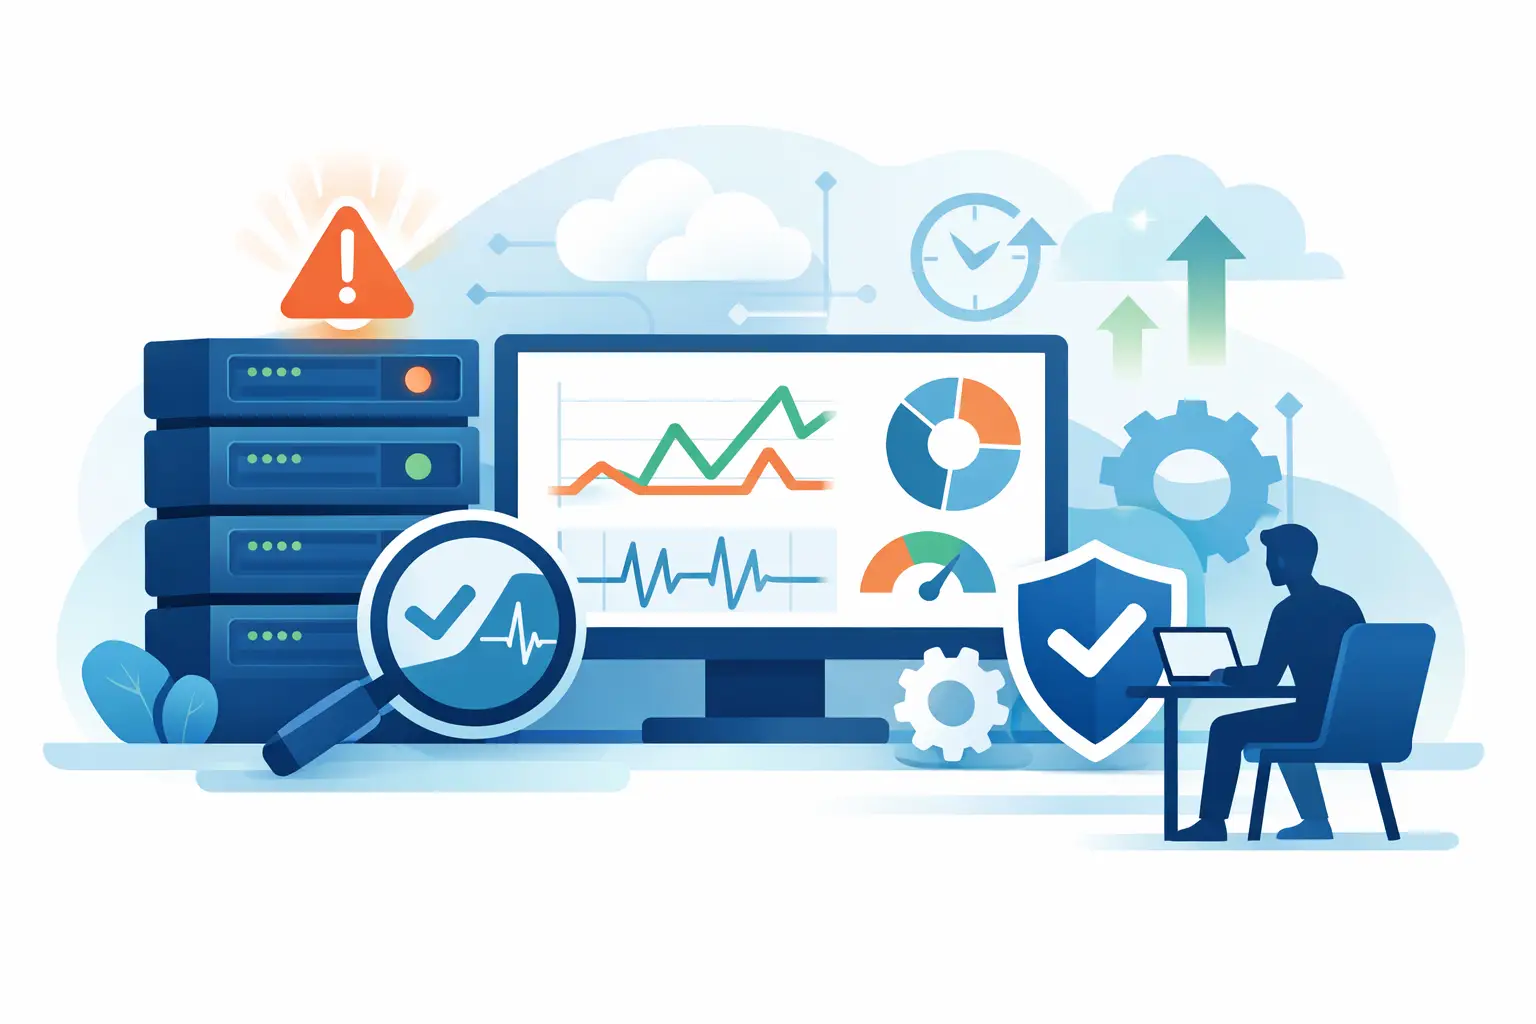
A website can look healthy from the dashboard while customers are seeing timeouts, checkout failures, or painfully slow pages. That gap is exactly why server monitoring matters. It gives you visibility into the infrastructure behind your website, application, email service, database, and cloud workloads before a small performance issue becomes lost revenue or a late-night emergency.
For a small business, agency, or growing online operation, monitoring is not about building an enterprise command center. It is about knowing what is running, what is under pressure, and when action is needed. The right setup helps you protect customer experience, avoid wasteful infrastructure costs, and make faster decisions without adding unnecessary technical overhead.
What Server Monitoring Actually Tracks
Server monitoring is the ongoing measurement of a server's availability, resource use, performance, and service health. A monitoring tool collects data at regular intervals and sends an alert when a metric crosses a defined threshold or a service becomes unavailable.
At the most basic level, you need to know whether your server can be reached. Uptime checks test whether a website, API endpoint, or service responds from outside your network. This is the customer-facing view of availability. If a visitor cannot load your site, it does not matter that a process still appears active inside the server.
You also need internal visibility. CPU usage shows how much processing capacity is being consumed. Memory usage reveals whether applications have enough RAM to operate normally. Disk space and disk input/output activity can expose a storage problem that will slow down databases, WordPress sites, backups, and file-heavy applications.
Network traffic, response time, running processes, error logs, and database connections add useful context. Not every business needs to track every metric on day one. The practical goal is to monitor the indicators that can explain a slow or unavailable service quickly.
Why Server Monitoring Pays for Itself
Downtime is the obvious risk, but slow performance can be just as expensive. A website that loads inconsistently may lose leads before visitors ever reach a contact form or product page. A slow online store can turn paid advertising spend into abandoned carts. For agencies, a missed issue can also weaken client trust.
Monitoring reduces the time between failure and response. Instead of waiting for a customer to report a problem, you receive a notification when the server stops responding, storage reaches a risky limit, or application performance degrades. That lead time is valuable because many infrastructure failures are predictable. A disk does not usually go from healthy to full without warning. Memory pressure, increasing response times, and growing error counts often appear first.
It also supports better spending decisions. If CPU and memory remain low over time, you may be paying for more capacity than your workload needs. If resources are consistently near their limit during peak traffic, an upgrade is easier to justify before your site becomes unreliable. Server monitoring turns capacity planning from guesswork into an operational decision based on real usage.
Start With the Metrics That Matter Most
A useful monitoring setup is focused. Too many alerts create noise, and noisy alerts get ignored. Start with the signals that tell you whether customers can use your services and whether the server has enough resources to support them.
Availability and response time
Monitor your public website, key landing pages, login pages, checkout flows, API endpoints, and any critical client portals. Availability alone is not enough. A service can technically return a response while taking 15 seconds to load. Track response time so you can spot degradation before it becomes an outage.
For an online store, test the pages that directly affect revenue. For a SaaS application, test authentication and the primary application endpoint. For a WordPress business site, monitor the homepage and contact form delivery path. The best check is the one that reflects a real customer action.
CPU, memory, and load
High CPU can result from traffic spikes, inefficient code, scheduled jobs, malware, poorly configured plugins, or a database query that needs attention. A brief peak may be normal. Sustained high usage is the real warning sign because it leaves little room for legitimate traffic increases.
Memory should be watched with the same perspective. A server using a high percentage of RAM is not automatically failing, but swap usage, repeated out-of-memory events, or growing memory consumption from one process deserves investigation. Track trends instead of reacting to a single number in isolation.
Storage capacity and disk performance
Storage alerts are among the easiest safeguards to configure and one of the most valuable. When a disk fills up, databases may fail to write, application logs may stop recording errors, email queues can stall, and backups can fail at the worst possible time.
Set an early warning threshold and a critical threshold. For example, an alert at 75% usage gives you time to clean old backups, logs, temporary files, or unused assets. A second alert at 90% signals that action cannot wait. If your workload depends heavily on databases or file processing, monitor disk input/output wait times as well, since a slow disk can make a healthy-looking server feel unresponsive.
Service and application health
Infrastructure metrics do not always reveal application-level failures. Your server may have normal CPU and memory usage while a web server, database, cache, queue worker, or email service has stopped. Monitor the services your business actually depends on.
For example, a managed WordPress site should have checks for web availability, database connectivity, scheduled backup completion, and critical plugin or theme errors. A cloud VM running a custom application may need checks for its web server process, database, SSL certificate expiration, background workers, and API error rate. The exact mix depends on what you run.
Build Alerts People Will Act On
An alert is only useful if it reaches the right person with enough information to respond. Avoid sending every warning to every team member. That approach creates alert fatigue and makes important events easier to miss.
Use at least two alert levels. A warning can notify the person responsible for routine maintenance when a trend needs attention. A critical alert should be reserved for conditions that affect customer access, data safety, security, or immediate capacity. If a server is down, a website is inaccessible, or disk capacity is almost exhausted, the notification should be immediate and clear.
Each alert should answer three questions: what failed, when it began, and what service or server is affected. Include a short runbook for recurring problems. It can be as simple as a note stating where to check logs, how to restart a service safely, who owns the system, and when to escalate.
Thresholds need adjustment over time. A CPU alert at 80% may make sense for one workload and be meaningless for another. Review historical patterns after a few weeks, especially around traffic campaigns, software releases, backup windows, and peak business hours.
Monitoring Is Not the Same as Management
Monitoring shows you a problem. It does not automatically fix it. A restart may restore a service temporarily, but repeated incidents need a root-cause review. That could mean optimizing a database query, replacing a resource-heavy plugin, resizing a cloud VM, moving files to object storage, improving caching, or changing a backup schedule.
The trade-off is simple: deeper monitoring provides more diagnostic detail, but it takes more time to configure and maintain. A new business does not need the same telemetry as a high-traffic software platform. Begin with uptime, resource capacity, and critical service checks. Add logs, traces, custom dashboards, and advanced application metrics as your operation grows.
Centralizing your infrastructure makes this easier. When domains, hosting, cloud VMs, storage, and business services are scattered across separate providers, identifying ownership and tracing an incident takes longer. A consolidated environment such as ACMMAX can reduce that friction by giving operators a clearer view of the services that support their online business.
A Practical Monitoring Routine
Set up monitoring when you deploy a new server, not after the first outage. Document the server's purpose, its public services, normal resource ranges, access owner, and backup location. Then test the alert process deliberately. Trigger a non-critical test notification and confirm that it reaches the right person.
Review the dashboard weekly, even when there are no incidents. Look for slow upward trends in disk use, response time, error counts, and resource consumption. Monthly, review whether your server size and configuration still match the workload. This habit takes far less time than responding to a preventable outage.
The goal is not to watch graphs all day. It is to run your digital operation with fewer surprises. When you can see trouble early, you can fix it on your schedule, protect the customer experience, and keep your business moving forward.